

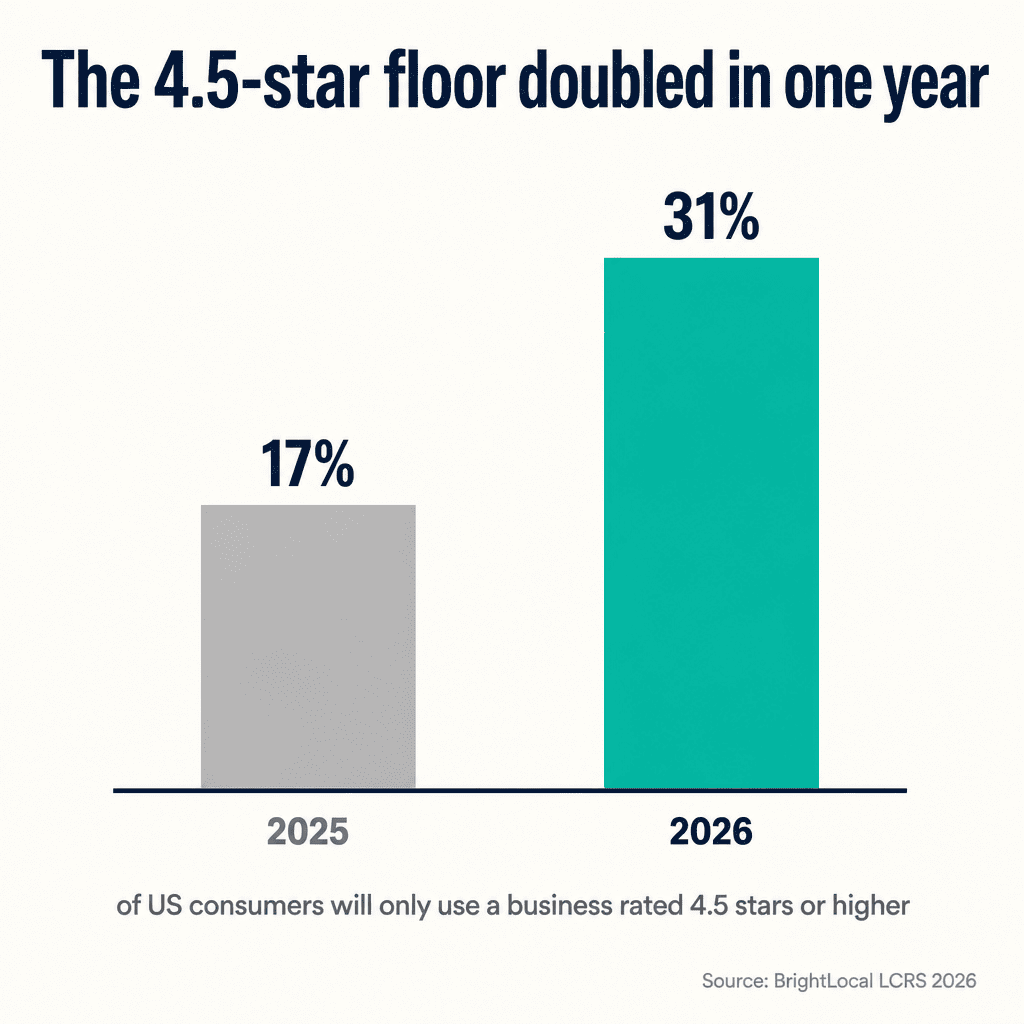
Roughly one in three Americans now says they will only use a business rated 4.5 stars or higher. Twelve months ago, that figure was closer to one in six. The shift was published in February 2026 by the longest-running independent consumer review survey in the industry, the biggest single-year jump in rating expectations the panel has measured in years.
For multi-location restaurant brands, this is the most expensive shift in consumer behaviour since the 2020 dine-in collapse. It is not the most consequential one. The bigger story is happening on AI search surfaces nobody on your marketing team has a dashboard for yet.
I run marketing at Pluspoint. This is the version of the story I would send to a peer CMO running 25 to 500 restaurant locations.
The 4.5-star floor doubled in twelve months
Five years ago, roughly half of American consumers said they would consider a business rated under 4 stars. Today, only a third would. Half the population once willing to chance a sub-4 restaurant has walked off the map.
The headline figure is the 4.5-star jump. The supporting behaviour is what changes how you operate. Three quarters of US consumers now only consider reviews from the last three months. Nearly nine in ten expect a response from the business they're reading about. Roughly half won't use a business with fewer than twenty reviews.
Why now? Two compounding pressures. Food-away-from-home prices rose around 6% from January 2024 to September 2025, per Bureau of Labor Statistics data summarised in McKinsey's 2026 restaurant outlook. And six in ten operators reported softer customer traffic in 2025, per the National Restaurant Association's 2026 State of the Industry. Diners are paying more, dining less, and screening harder before each visit.
What a half-star is worth in 2026 dollars
Black Box Intelligence's 2026 reputation benchmarks, tracking over 100,000 restaurant units and $153B in annual sales, map a typical Average Star Rating lift to around $39K per QSR unit per year and $125K per casual dining unit. Their position is unusually direct for an industry analyst:
Average Star Rating is not a vanity metric; it is a highly predictable revenue driver.
Black Box Intelligence, 2026 reputation benchmarks
For a 10-location casual dining group moving from 3.8 to 4.3 stars across the board, the math comes out to roughly $625K of incremental annual revenue. The unintuitive part is where the lift comes from. Most multi-unit groups invest reputation budget in their already-strong locations. The ROI sits at the back of the portfolio.
The plot twist nobody has dashboards for
The 4.5-star economy is real for humans. The humans evaluating your restaurants in 2026 are increasingly not humans at all. AI assistants now sit between the diner and your front door, and they apply different math.
The cleanest independent measurement is the AI Restaurant Intelligence Report 2026, which ran tens of thousands of verifications across ChatGPT, Gemini and Perplexity in 100 US cities. Per-engine star floors held consistently across markets: roughly 4.3 on ChatGPT, 4.1 on Perplexity, 3.9 on Gemini.
Above those floors, review corpus dominates. Research from MyPlace.app, published February 2026, found that AI-recommended restaurants average roughly 3.6 times more Google reviews than comparable non-recommended ones. Star ratings above 4.4 added almost nothing. Volume did the work.
Adoption explains the urgency. In 2025, around 6% of consumers used AI tools to find local businesses. In 2026, that figure jumped to 45%. The discovery surface flipped under operators' feet without showing up on most reporting decks. We walked through one expression of that shift in how Google Maps' Ask Maps rewrote local discovery.
Two 4.5-star economies, side by side
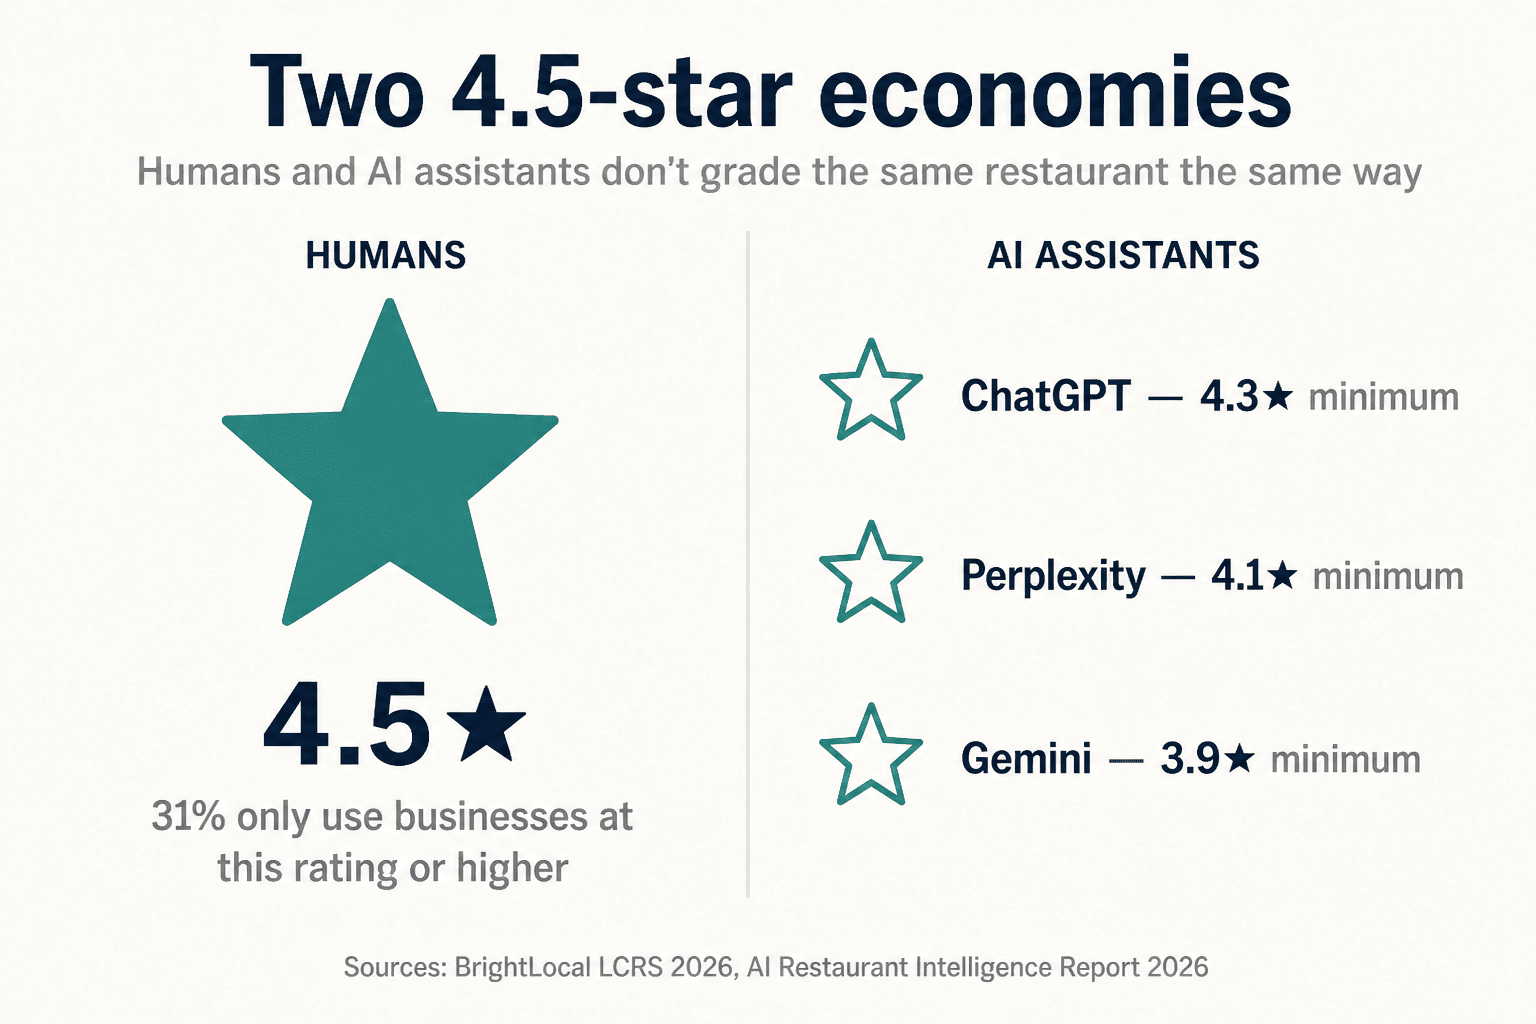
This is the cheat sheet I send to operators when they ask which surface to optimise for first.
The honest read: a 4.0-star location can hold a Google local pack slot but fall below the threshold ChatGPT uses to recommend. A 4.8-star location with 200 reviews can outrank a 5.0 with 20 reviews on Google but stay invisible in AI because the corpus is too thin. Two systems, two reward functions.
Velocity, recency, response
Total review volume across the local economy grew about 13% year over year in 2025. Volume is no longer the constraint. Recency is. Three quarters of US consumers in the 2026 consumer review panel said they only consider reviews from the last three months. A restaurant with 1,500 reviews from 2018 to 2022 and silence in 2025 reads, from a perception standpoint, near zero.
Response rate is the third leg. Restaurants answer roughly half of their reviews on average, and most negative reviews go entirely unanswered. Consumer expectations have moved the other way. Nearly nine in ten now expect a response, most within a week. Half are deterred by templated, generic replies.
Operators that maintain a 90% response rate over six months see an average rating lift of 0.15 stars. At the boundary where ChatGPT's threshold floats, 0.15 stars is the difference between recommended and invisible. Popmenu's 2026 operator survey found that 87% of US restaurant operators plan to sharpen focus on reputation management this year. The result hasn't shown up in benchmarks yet because most teams do the work manually, location by location, without a system.
The playbook that compounds in 2026
Google's Gemini-powered review moderation, rolled out in April 2026, raised the quality bar for what gets through. Reviews that survive the filter share a profile: post-visit, unprompted, written by a real customer, and met with a personalised response from the operator within twenty-four hours.
The playbook that wins now is unglamorous and continuous. Trigger the request from POS at the moment of payment, after the customer has left the building. Reply to every review, positive and negative, in a voice that sounds like the operator and not a template. Hold the cadence for six months.
Operators who run this consistently see their per-location rating climb at roughly 0.15 stars over that window. At the 4.3-to-4.5 boundary where AI assistants decide whether to recommend, 0.15 is the difference between visible and not. The math has been the same for a decade. The platforms are only now enforcing it. Multi-location brands that already had a system in place ride the wave. Brands still running review collection manually have a real catch-up problem.
The multi-location math that moves the portfolio
Most reputation programmes in multi-location brands optimise the wrong locations. The corporate reporting deck shows the brand average. The brand average is the wrong number. Inside Pluspoint's data across multi-location restaurant operators, the gap between the highest- and lowest-rated store in a single brand routinely runs 0.6 to 0.9 stars wider than the brand-aggregate report implies. The lowest-rated location is almost never the one the marketing budget is propping up.
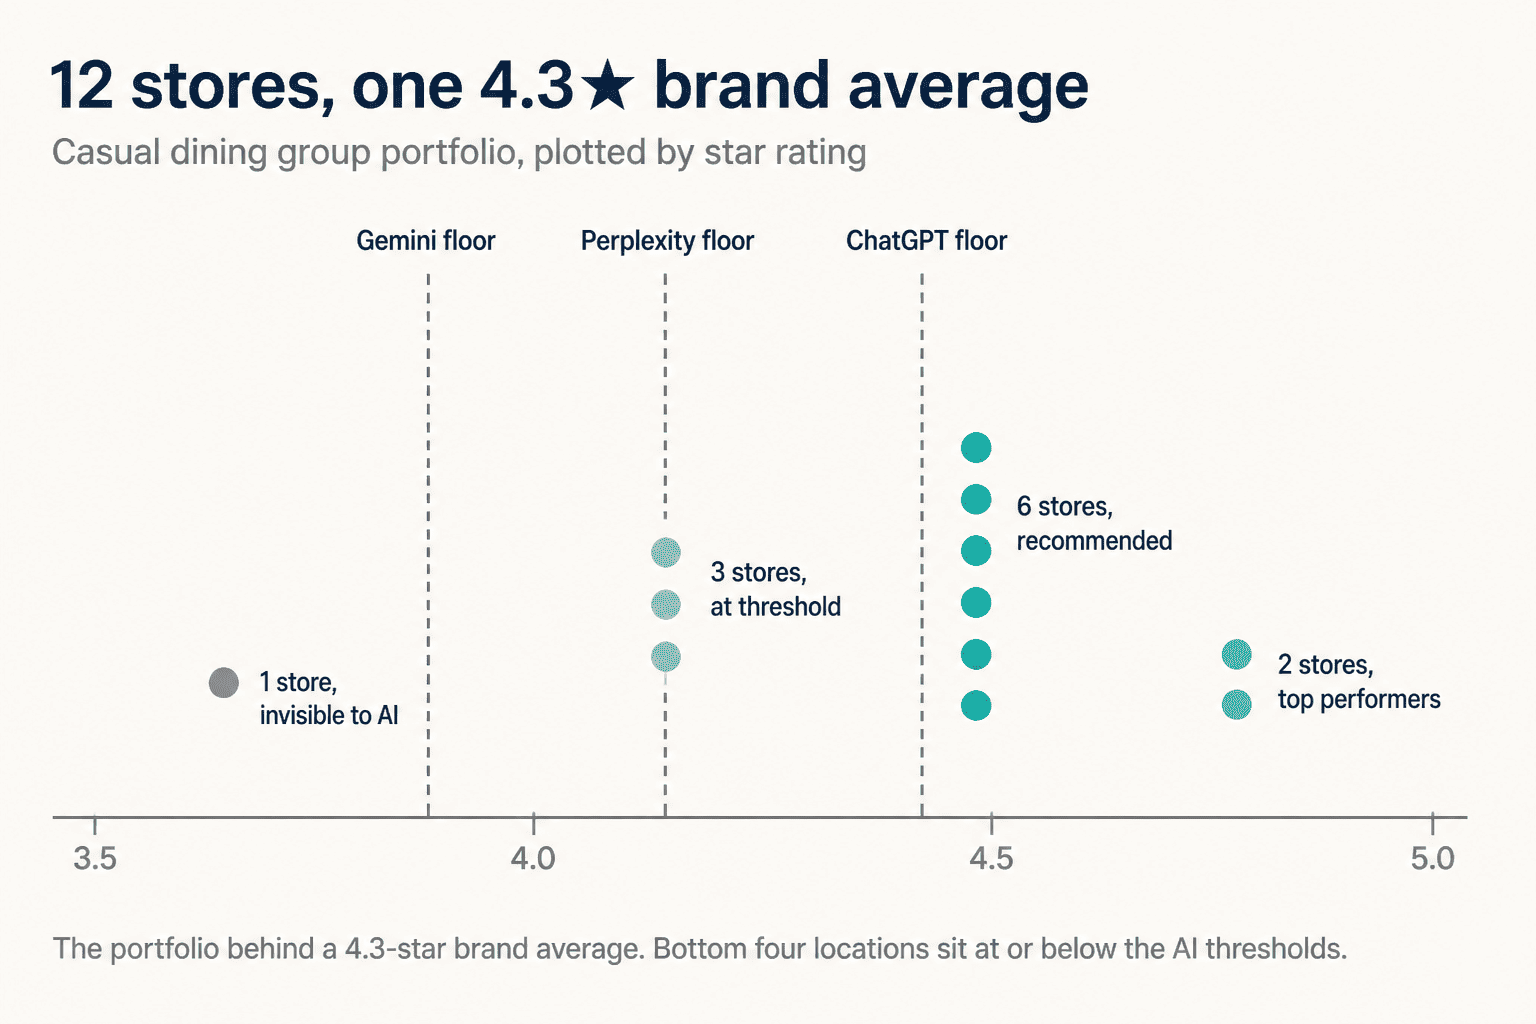
Take a 12-restaurant casual dining group with a portfolio average of 4.3 stars. The breakdown:
- 2 stores at 4.6, the top performers
- 6 stores at 4.4, clearing every AI threshold
- 3 stores at 4.1, right at the Perplexity floor, below the ChatGPT floor
- 1 store at 3.7, invisible to AI recommendations of any kind
The brand average looks healthy. The portfolio is not. Four of twelve locations are at or below the AI thresholds.
Now the spend question. Imagine an extra $40K a month becomes available for the brand. Most marketing teams pick a fourth channel. The math points elsewhere.
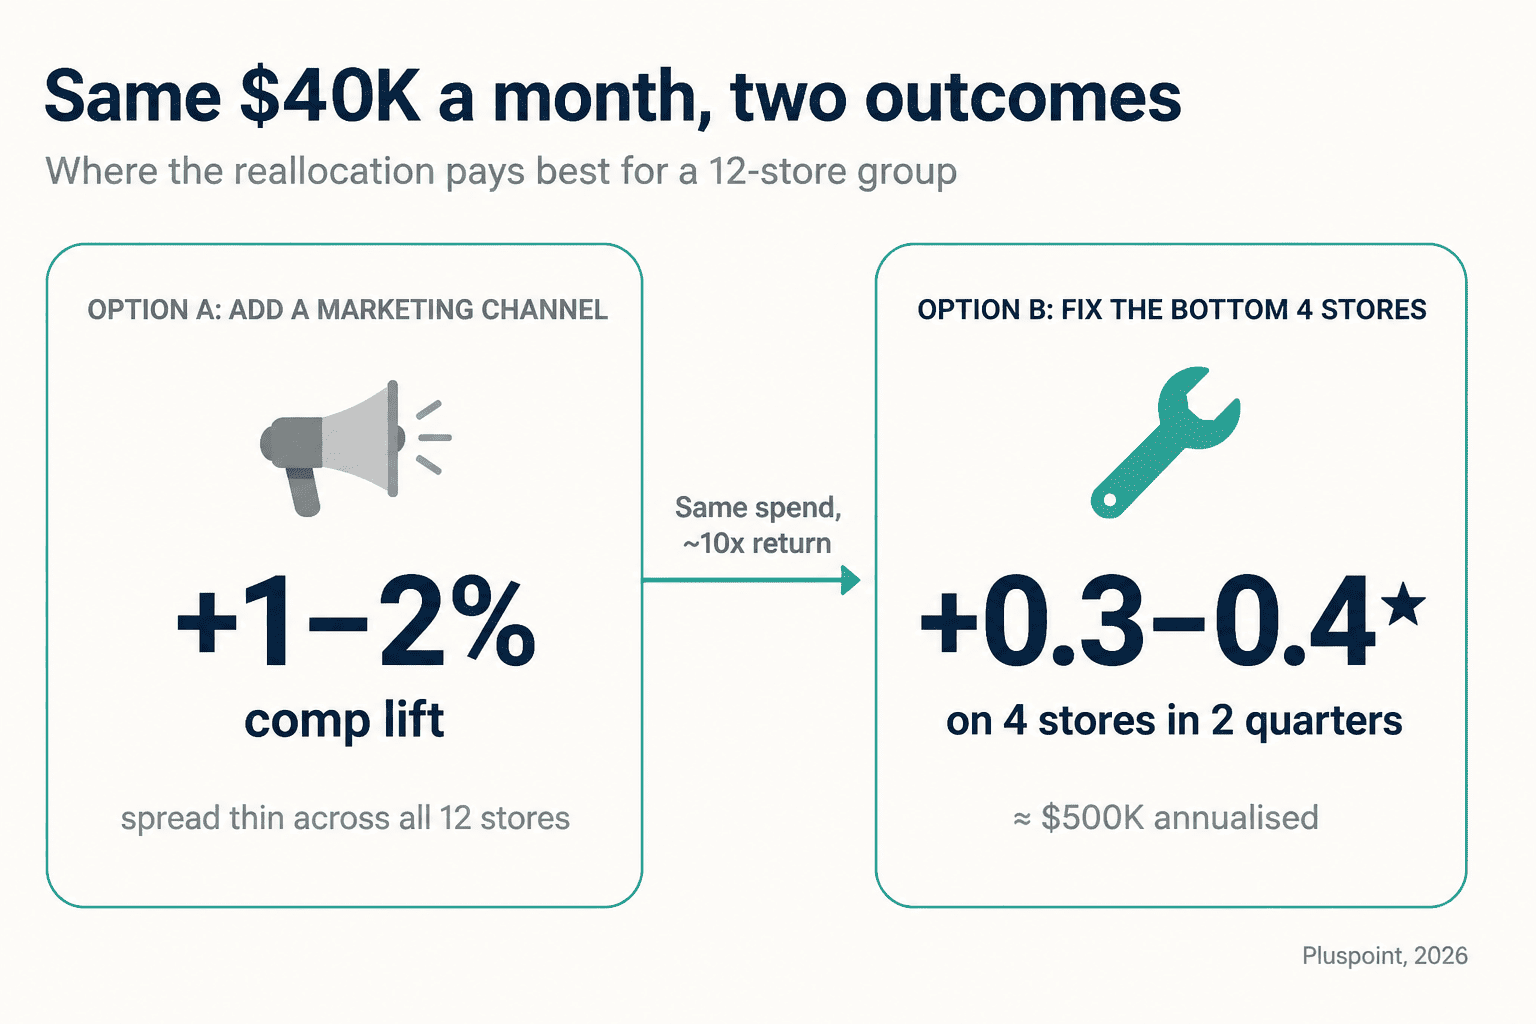
A new channel buys a thin layer of growth spread across all 12 stores. Fixing the bottom four stores, training, kitchen consistency, dedicated review-velocity work, buys real movement at the locations holding the brand back. It is not an intuitive answer for a CMO whose dashboard reports group means. It is the answer the data supports.
The Q3 2026 playbook
Concrete steps in the order I would run them. None of these require Pluspoint specifically. Most can be assembled from the stack you already have, and if you want a deeper bench, we've collected 18 micro-optimisations that compound across locations.
1. Audit every location against three thresholds
Score each location against the human floor (4.0 entry, 4.5 premium), the Google visibility floor (4.5 with 50+ reviews), and the AI floor (4.3 ChatGPT). Flag anything below 4.3 as at-risk in AI search regardless of Google performance. If the underlying Google Business Profiles are messy, our 4-step cleanup framework is the prerequisite.
2. Set per-location review targets, not brand-aggregate ones
Aim for 15 to 30 new reviews per month at high-traffic restaurants, with at least a fifth from the last 90 days. Trigger requests from POS at the moment of payment via SMS or email. Drop tablet kiosks before Google flags the location.
3. Move review response under 24 hours, 100% response rate
A third of consumers expect a next-day response, and half are deterred by templated replies. The viable model is AI-assisted personalisation with a human owner approving every response above a sentiment threshold.
4. Stand up location-level AI visibility monitoring
Test category prompts like "best pizza near [neighborhood]" and "quiet dinner for two in [city]" across ChatGPT, Gemini, Perplexity, Google AI Overviews and DoorDash Zesty for every market you operate. Run weekly. Track Share of Voice as the primary KPI.
None of this is software-dependent on day one. A calendar reminder, a shared spreadsheet, and one team member who runs the cadence will outperform most multi-location brands for the first quarter. Teams eventually move to dedicated tooling, whether Pluspoint or one of the alternatives, not because the spreadsheet stops working but because the spreadsheet stops being maintained. The same marketing team is running paid, social, email, local pages, and quarterly reporting at the same time. Pick the moment yours stops being maintained. That is when reputation becomes a software problem.
Frequently asked questions
What star rating do US diners require from restaurants in 2026?
Roughly one in three US consumers now refuses to use a business rated below 4.5 stars in 2026, nearly double the share reported a year earlier in the longest-running independent US consumer review panel. Most consumers will not use a business below 4.0 stars at all.
What star ratings do AI assistants use to recommend restaurants?
Independent benchmarking across 100 US cities in 2026 found per-engine star floors of roughly 4.3 on ChatGPT, 4.1 on Perplexity, and 3.9 on Gemini. A restaurant at 4.0 stars can still rank in Google but fall below the threshold AI platforms use to recommend.
How many reviews does a restaurant need to appear in AI recommendations?
AI-recommended restaurants average roughly 3.6 times more Google reviews than comparable non-recommended restaurants (MyPlace.app research, February 2026). Above the 4.4-star threshold, review volume becomes the deciding signal in AI restaurant discovery.
What is the revenue impact of a star rating increase for restaurants?
Black Box Intelligence's 2026 reputation benchmarks map a typical Average Star Rating lift to roughly $39K per QSR unit per year and $125K per casual dining unit. A 0.5-star group-wide lift across a 10-unit casual dining brand maps to roughly $625K in incremental annual revenue.
How fast must restaurants respond to reviews in 2026?
Nearly nine in ten consumers now expect a response, with most expecting it within a week (2026 consumer review panel data). Restaurants currently respond to less than half of reviews on average. A 90% response rate maintained over six months produces a 0.15-star rating lift.
What review-acquisition tactics work in 2026?
The reliable playbook is post-visit, post-payment SMS or email requests sent after the customer has left, and personalised responses to every review within 24 hours. Operators who hold a 90% response rate over six months see their per-location rating climb roughly 0.15 stars over that window.
Sources
- BrightLocal Local Consumer Review Survey 2026 (n=1,002 US adults, fielded February 2026)
- McKinsey, "What US consumers want from restaurants in 2026"
- National Restaurant Association 2026 State of the Restaurant Industry
- Black Box Intelligence 2026 reputation benchmarks (100,000+ restaurant units, $153B annual sales)
- AI Restaurant Intelligence Report 2026 (29,822 verifications across ChatGPT, Gemini, Perplexity in 100 US cities)
- MyPlace.app AI Ranking Factors for Restaurants Research (February 2026)
- Popmenu 2026 Restaurant Trends (n=328 US operators)
- Google Trust & Safety, AI moderation announcement (April 2026)
Dmytro Semonov runs marketing at Pluspoint, the local AEO/GEO platform for multi-location brands. He writes about reputation, AI search and multi-location marketing for restaurant, dental, automotive and home-services CMOs. LinkedIn · @dsemonov

.png)
%20(1).png)
.png)